Cost of Quality Implementation: A Practical Approach
Most times, merely knowing the current cost of quality (COQ) status is often insufficient.

Image Source: Generative AI image created via Adobe Firefly
This article introduces the fundamental concepts of Cost of Quality (COQ) and explores two widely used models: the Prevention-Appraisal-Failure (PAF) model and the Process Cost Model (PCM). It outlines practical methods for categorizing and tracking COQ data using spreadsheet tools, especially suited for small and mid-sized organizations. COQ implementation serves as a valuable framework for continuous improvement, informed decision-making, and aligning quality initiatives with business performance goals.
1. Fundamental Concepts of COQ
Cost of Quality (COQ) helps financially measure quality efforts to guide improvements that more effectively contribute to a company’s financial performance. According to ASQ, COQ serves as a financial framework that supports both aspects and provides a quantitative foundation for making decisions about quality investments and improvements.
One of the foundations of COQ is the recognition of various cost items related to quality and their categorization for monitoring and analysis purposes. A widely used approach is to classify all COQ items into four categories, as listed below with typical examples from manufacturing operations:
Prevention costs (P): Quality by design, quality planning, quality management systems, preventative maintenance, employee training, etc.
Appraisal costs (A): Testing equipment, system monitoring, in-process inspection, data analysis, supplier management, materials, etc.
Internal failure costs (Fi): Scrap, waste, product downgrade, rework/repair, problem-solving, maintenance/adjustment, product design modifications, etc.
External failure costs (Fe): Returns/replacements, price adjustments, legal/insurance fees, complaint handling, warranty repairs, investigations, etc.
This PAF model (or COQ = P+A+Fi+Fe) is widely adopted. The Process Cost Model (PCM) offers a more streamlined approach by focusing on cost implications within specific processes or systems. The PCM focuses on a specific process, operation, or system and categorized all cost items, including staff, equipment, materials, activities, and operational environment, into two main types:
Cost of Conformance (COC): the cost incurred to ensure good quality, referred to as “good COQ”.
Cost of Nonconformance (CONC): the cost incurred due to poor quality, referred to as “bad COQ”.
The PAF model provides specific characteristics of COQ items, which can be helpful for analysis. In contrast, the PCM (or COQ = COC+CONC) offers a simpler approach without detailed cost breakdowns. Thus, the PCM may be more user-friendly in its application in some cases. Figure 1 illustrates that both PAF and PCM offer distinct perspectives on categorizing COQ.
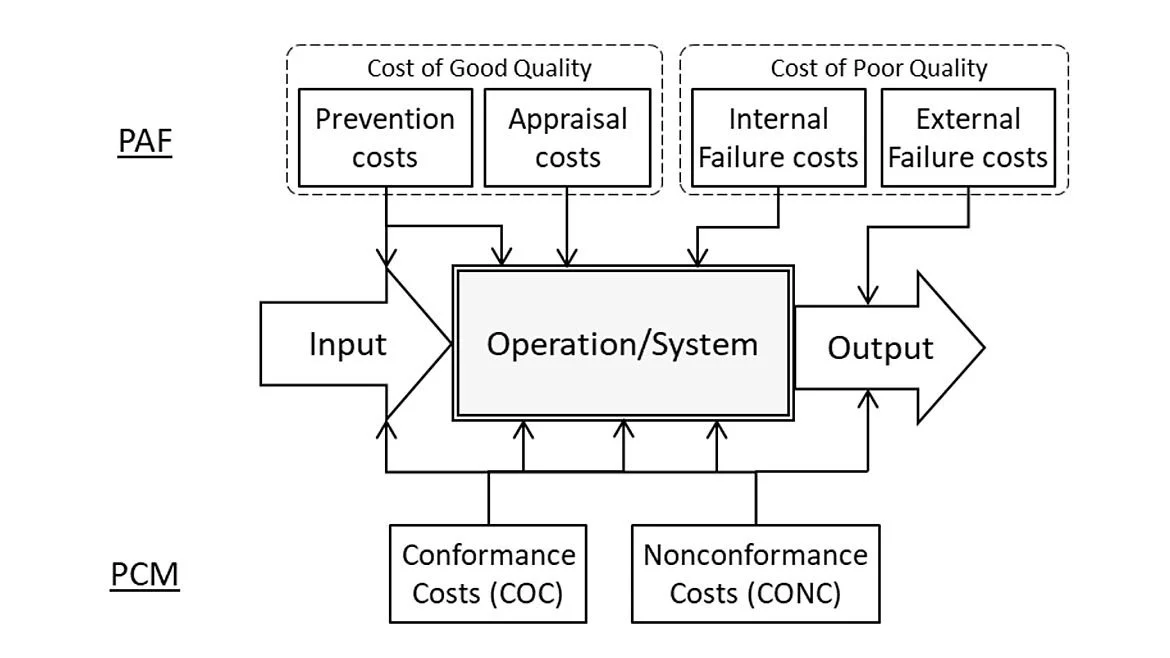
Figure 1 Comparison between PAF and PCM cost categorization Source: Dr. Herman Tang
Other COQ models, such as Activity-Based Costing (ABC), the Taguchi Loss Function, and Total COQ, can be considered.
2. Cost Categorization in PAF and PCM
Effective cost categorization is essential for understanding quality-related expenditures and informing strategic decisions. While categorizing COQ items under the PAF model is often straightforward, certain items may appear unclear or to overlap categories, leading to subjectivity in classification. A recommended flowchart to aid in the categorization of COQ items within the PAF framework is shown in Figure 2.
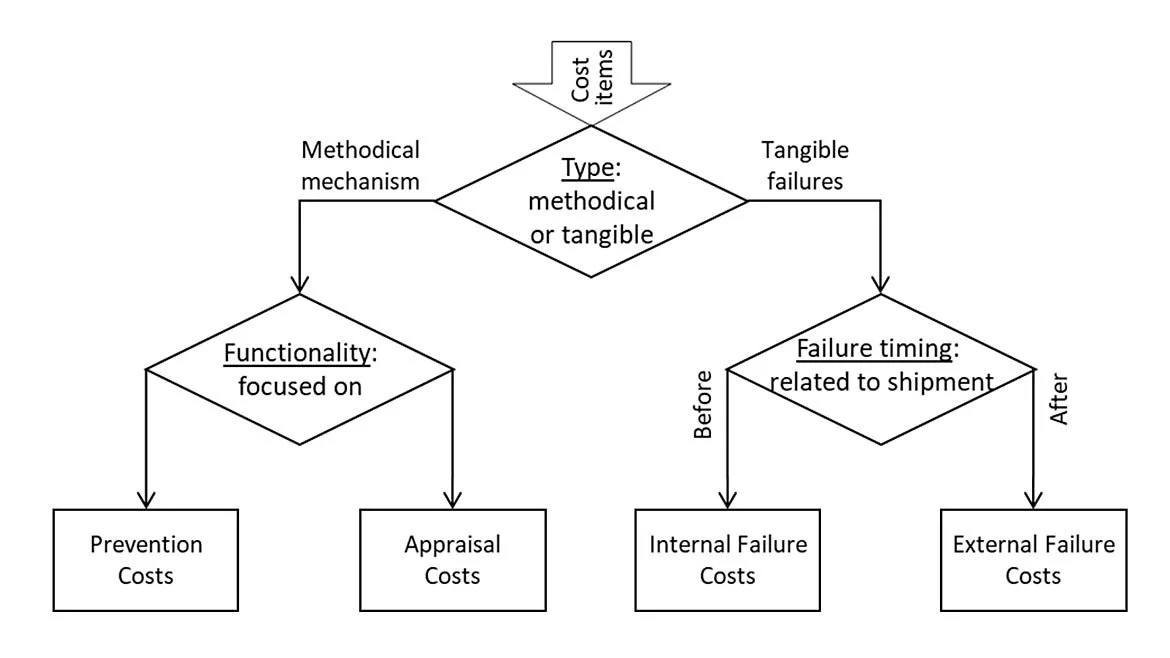
Figure 2 COQ categorization framework for the PAF model Source: Dr. Herman Tang
Under PCM, each COQ item can be classified by asking whether it supports good quality (COC) or results from poor quality (CONC). Similar to the decision-making process used in the PAF model (as illustrated in Figure2), the process for identifying and distinguishing COC and CONC items is depicted in Figure 3.
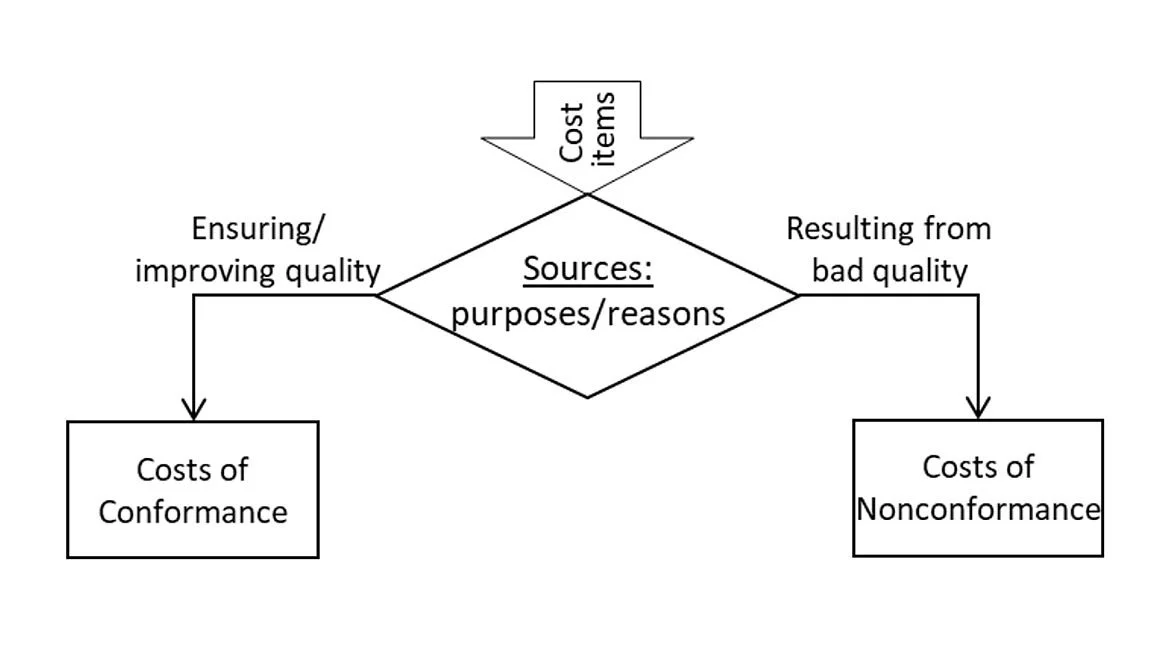
Figure 3 COQ categorization framework for the PCM model Source: Dr. Herman Tang
Once COQ categorization is completed, the implementation of a COQ model, often referred to as a COQ program, can begin. The next section introduces a simple and effective method for applying the PAF and PCM models to track and reduce these costs.
3. Simple Approach to COQ Implementation
There are various methods and processes for implementing a COQ program. This section introduces simple, spreadsheet-based approaches suitable for organizations beginning a COQ journey. When commercial software solutions (modules) are available, implementation can become more efficient and scalable.
The overall implementation process consists of five major steps, embedded with problem-solving (PS) and continuous improvement (CI) initiatives. To guide initial implementation, a five-step process aligned with PS/CI principles is outlined in Figure 4.
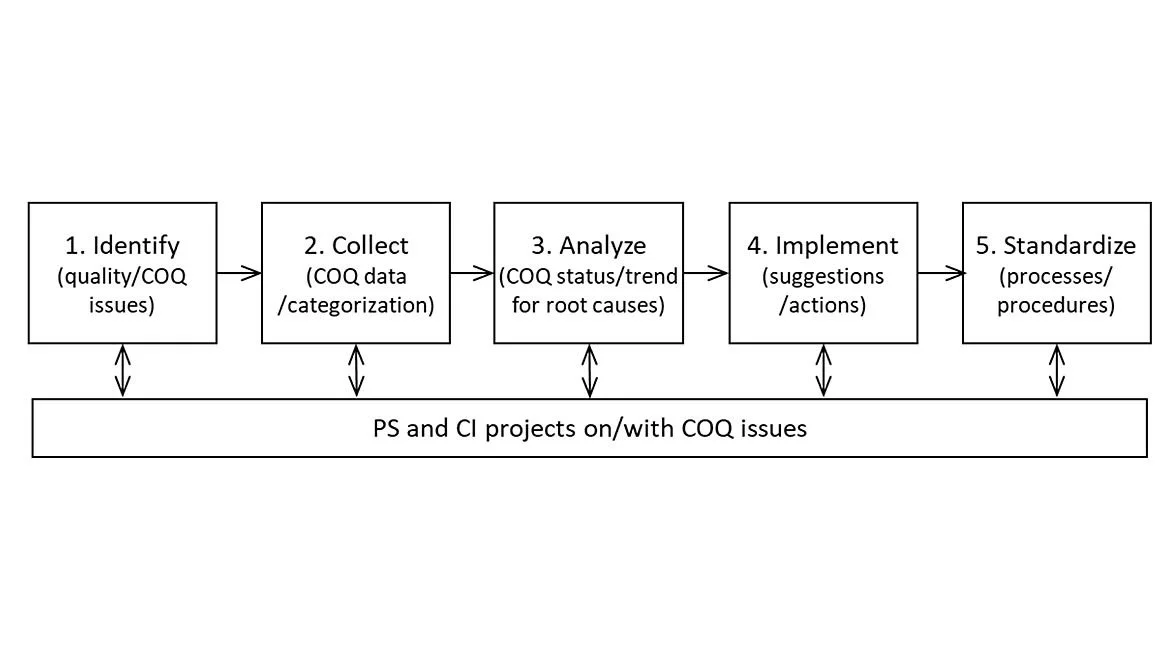
Figure 4 Major steps to initiate and develop a COQ program Source: Dr. Herman Tang
This stepwise process aligns with commonly used PS/CI methodologies. In Step 2, simple templates created using MS Excel can be used for COQ recording, tracking, and analysis. Spreadsheets offer a low-cost, flexible way to begin capturing COQ data, especially for organizations without dedicated quality management software.
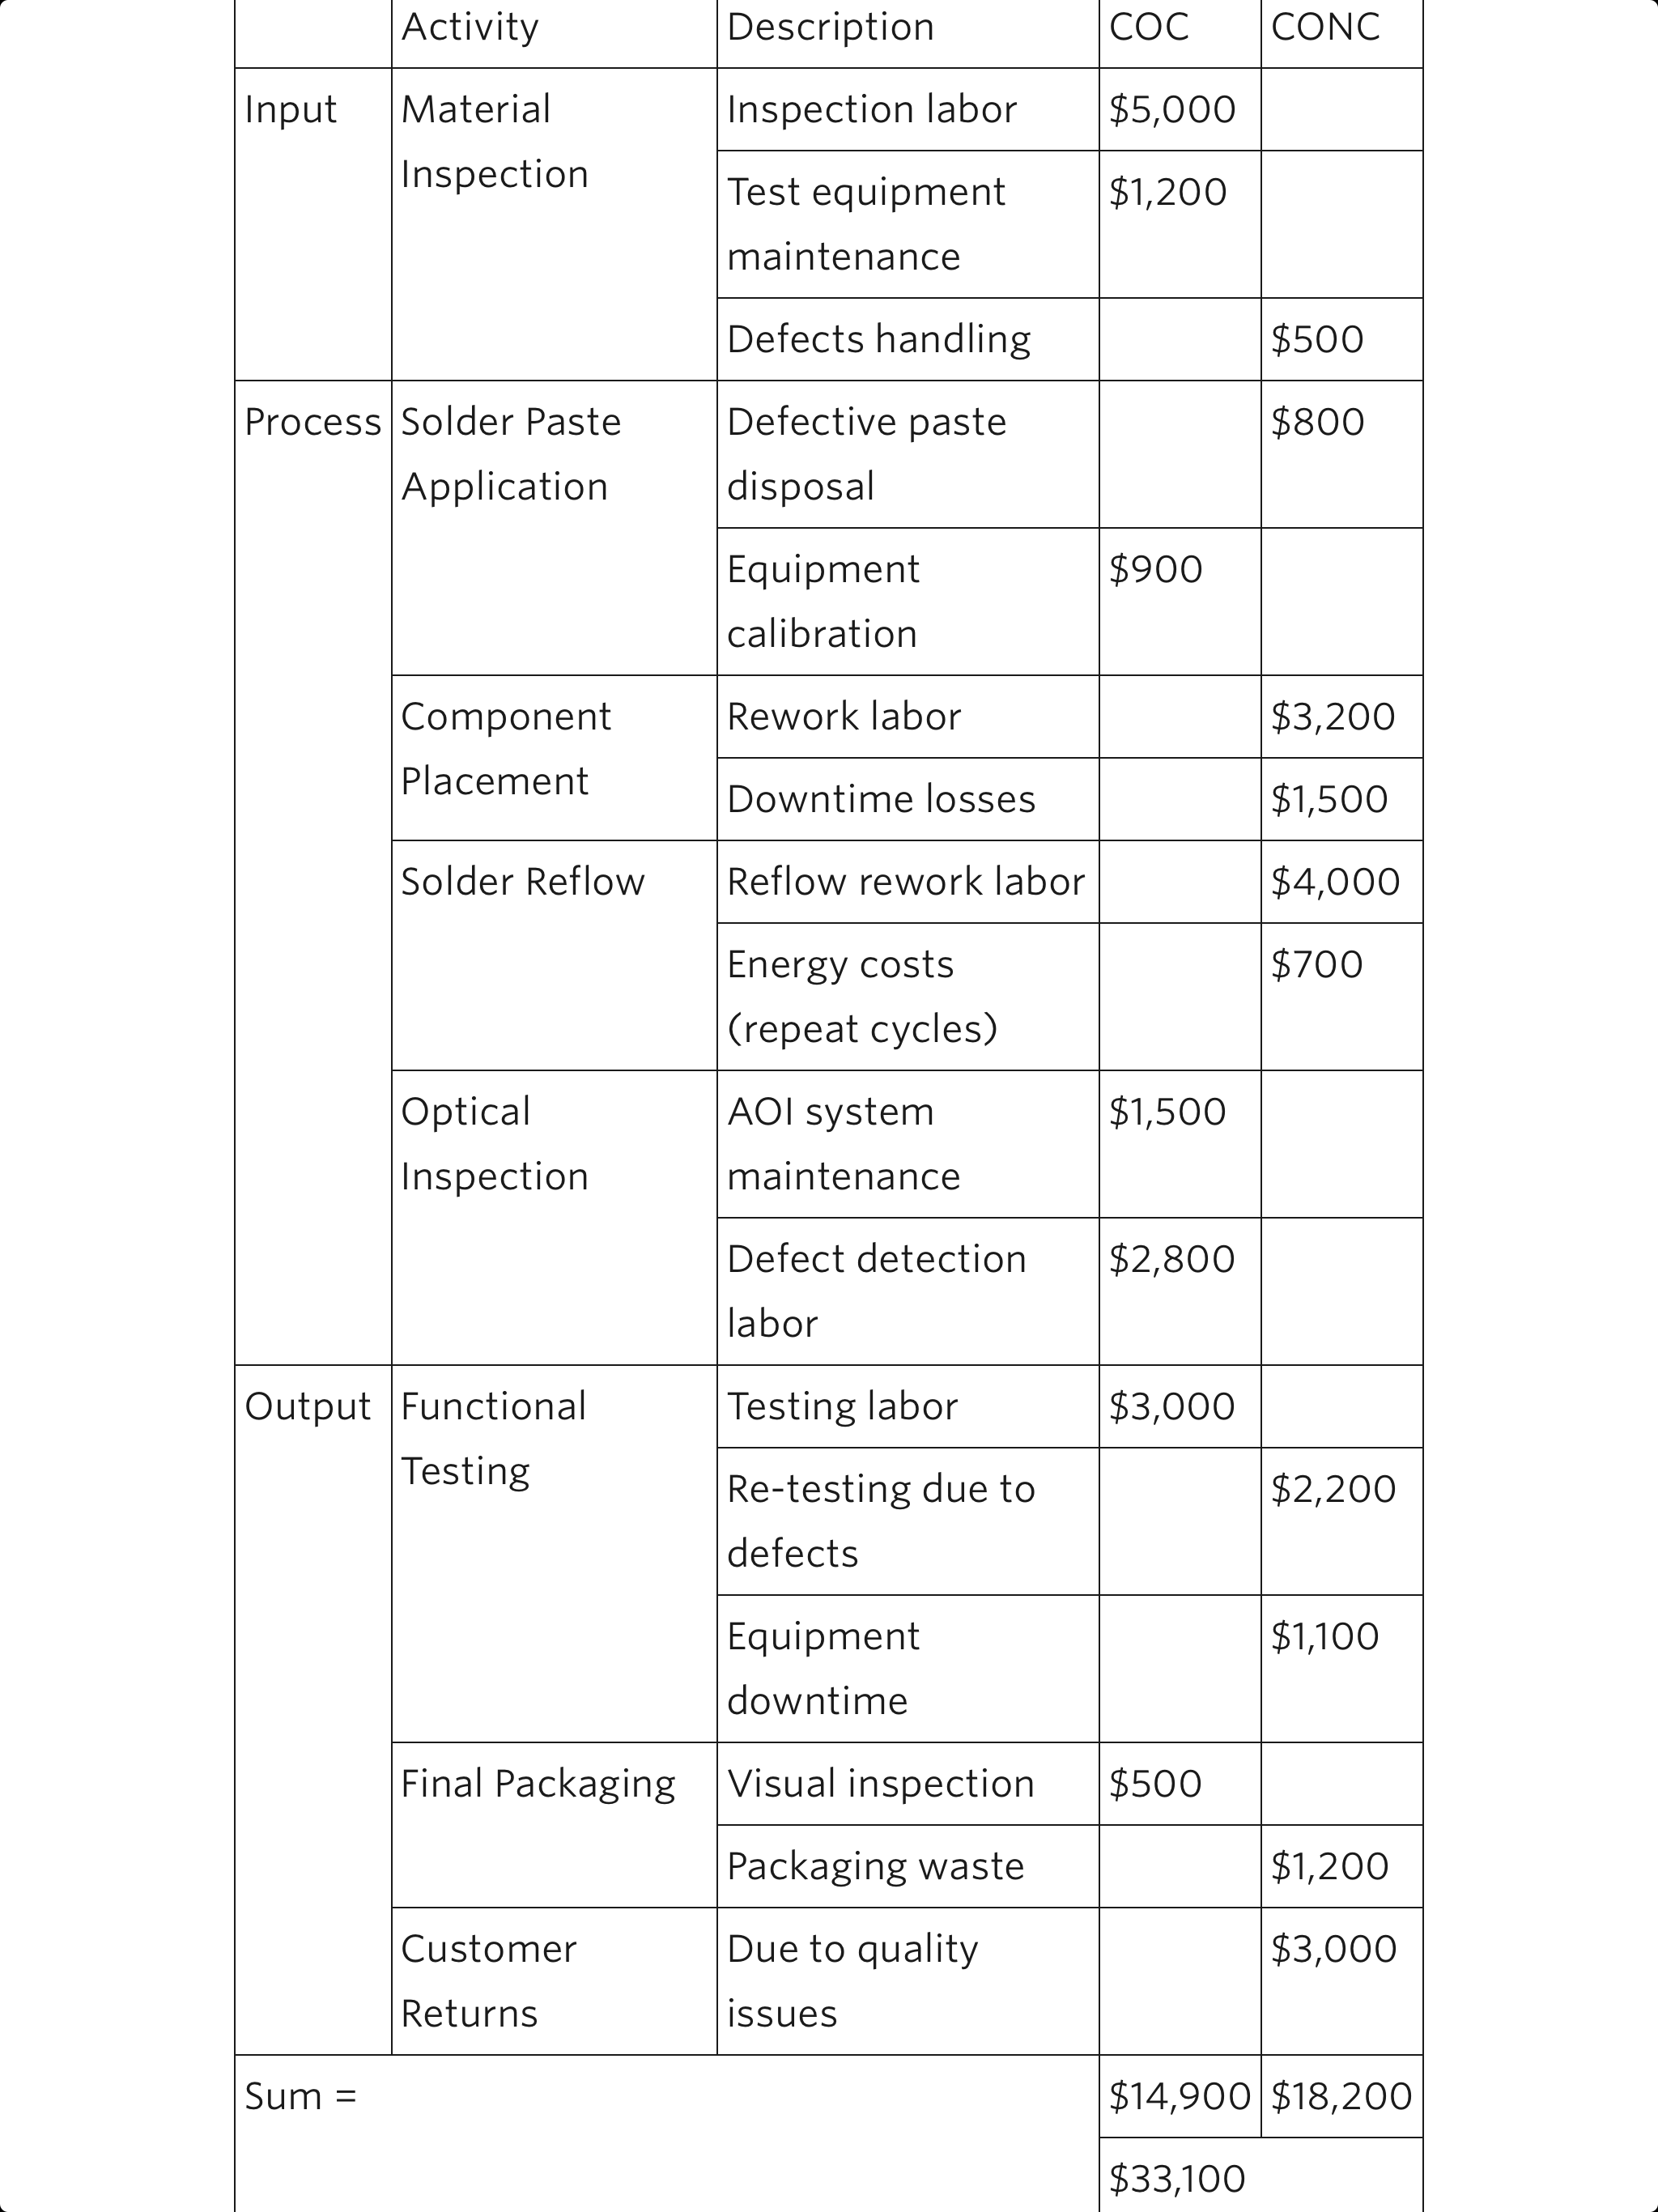
Tables 1 and 2 provide two simple examples of templates based on the PAF and PCM models, respectively. These forms can be customized to suit specific operational needs.
Table 1 COQ data categorization based on PAF model Source: Dr. Herman Tang
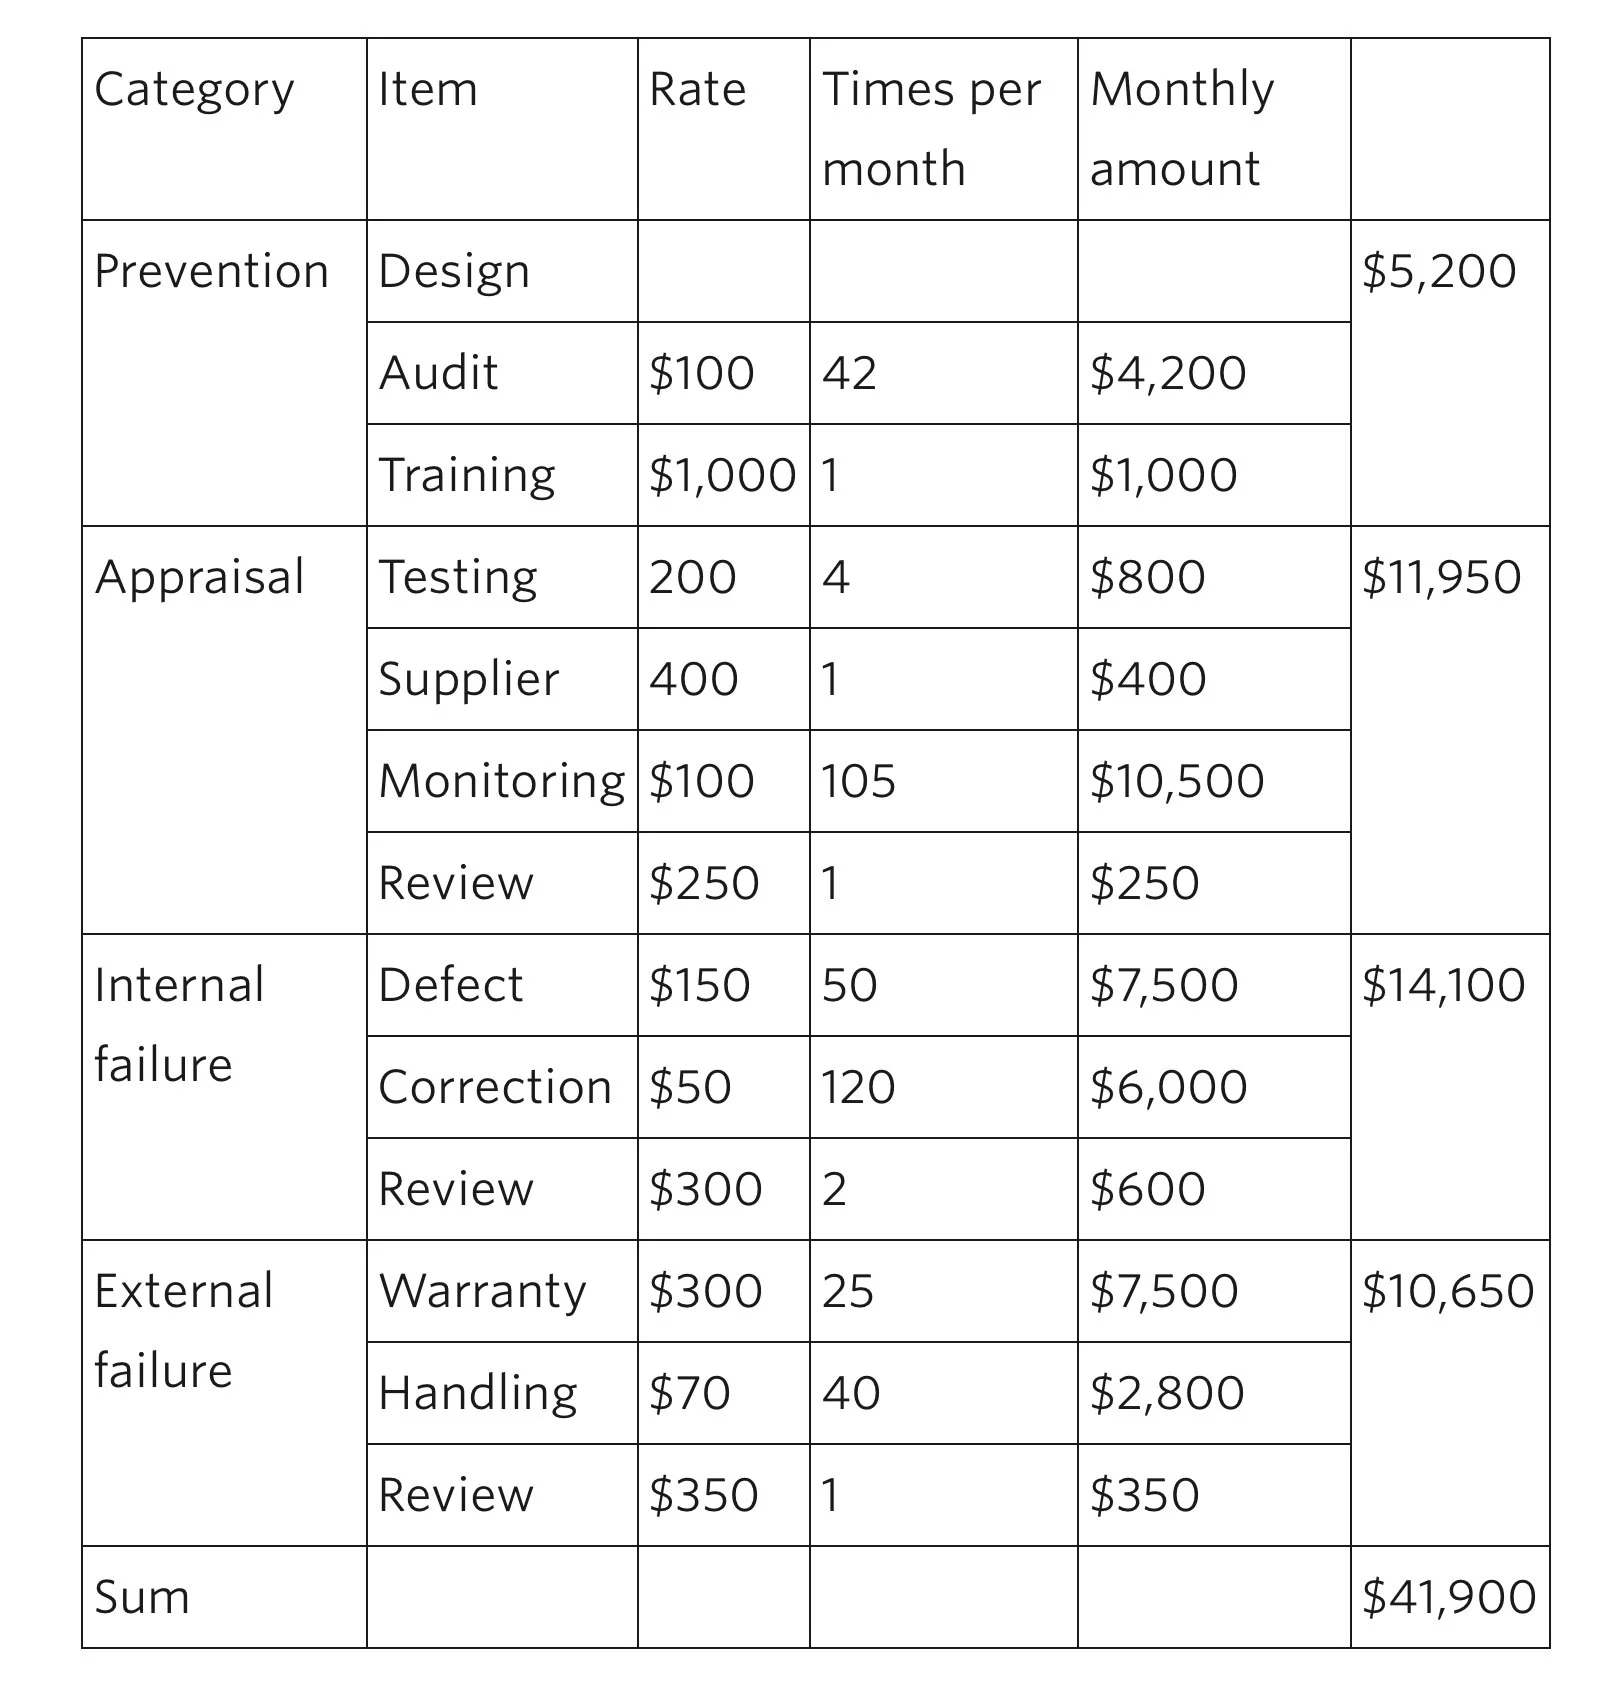
Table 2 COQ data categorization based on PCM model Source: Dr. Herman Tang
4. Discussion and Remarks
After setting up a COQ program, analyzing trends helps identify improvement opportunities. Most times, merely knowing the current COQ status is often insufficient. Without appropriate benchmarks or historical comparisons, it is difficult to determine whether the levels of COQ or individual COQ categories are reasonable for a specific business context. This discussion focuses on the commonly used PAF model to explore such dynamics.
Quality improvement can result in a reduction of internal and external failure cost. However, achieving better quality frequently requires increased investment in preventive and appraisal activities. These investments can include enhanced planning, employee training, and more inspections. The general relationships between good and bad COQ are depicted in Figure 5.
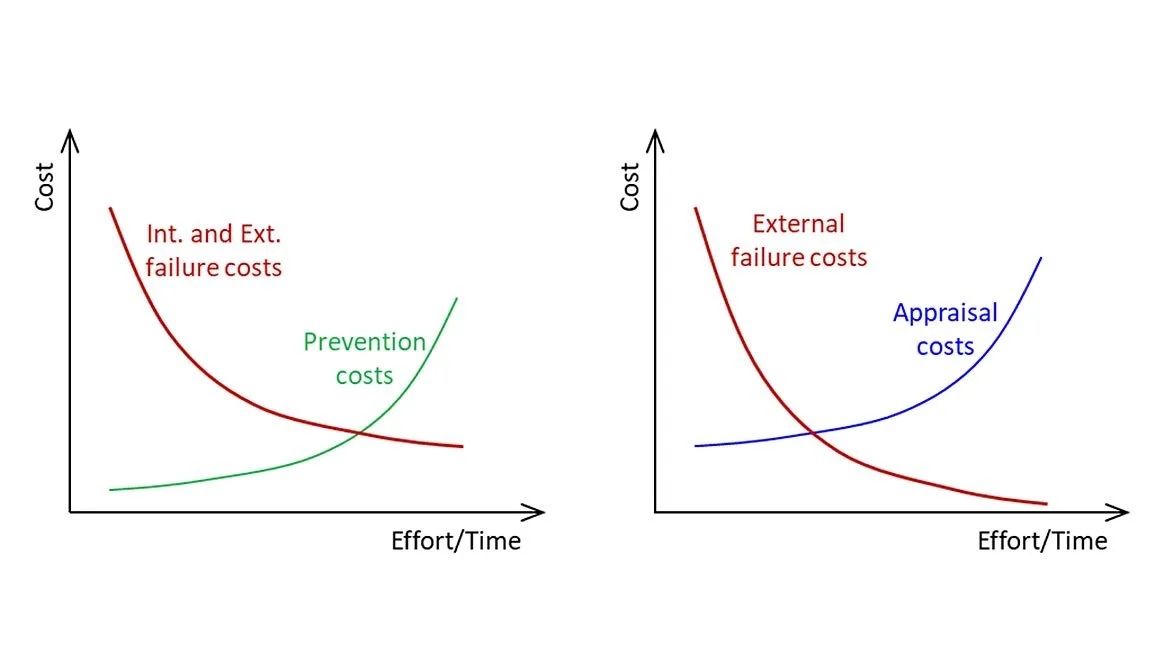
Figure 5 General relationships between good COQ and bad COQ Source: Dr. Herman Tang
In practice, COQ trends often exhibit fluctuations due to various known and unknown factors. Nevertheless, some general patterns can be observed. As shown in Figure 6, there are three typical scenarios: 1) high failure costs (poor quality), 2) high prevention/appraisal costs (premium quality), and 3) a balanced approach (cost-quality trade-off). Successful improvement projects shift costs from failures to prevention, optimizing quality and cost (Figure 6). Where, 1) is a common situation, indicating significant room for improvement of quality and COQ.
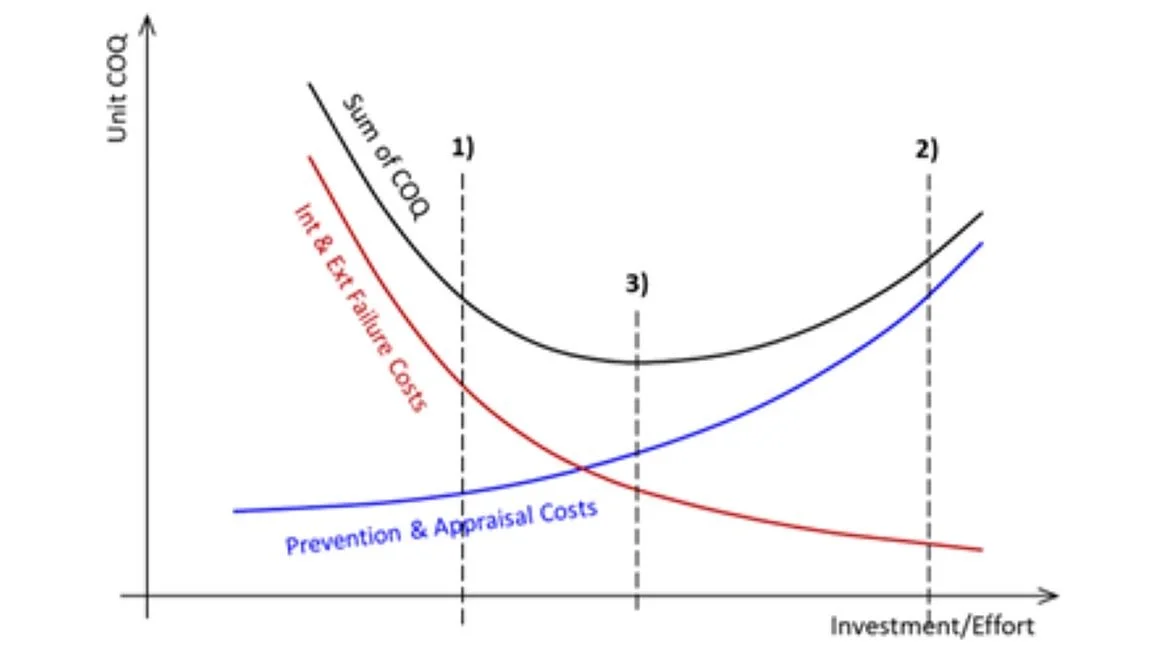
Figure 6 Typical COQ Scenarios Based on the PAF Model Source: Dr. Herman Tang
With successful execution of multiple PS/CI projects, COQ trends often evolve in a zone between Scenarios 1) and 3). To progress further, in-depth reviews and refinements of the COQ program may be necessary.
The positive correlation between quality and business performance is widely recognized. Implementing COQ principles can enhance the relationship. This article has briefly introduced fundamental concepts and simple methods for COQ implementation.
In summary, implementing COQ using PAF or PCM models helps organizations cut failure costs and boost quality. Start with cost categorization and simple Excel templates to track costs, monitor trends, and drive continuous improvement. As your program grows, explore advanced tools to maximize impact and effectiveness.
