AIAG–VDA Convergence
The future of SPC, MSA, and calibration.
By Dan Lay Jr.

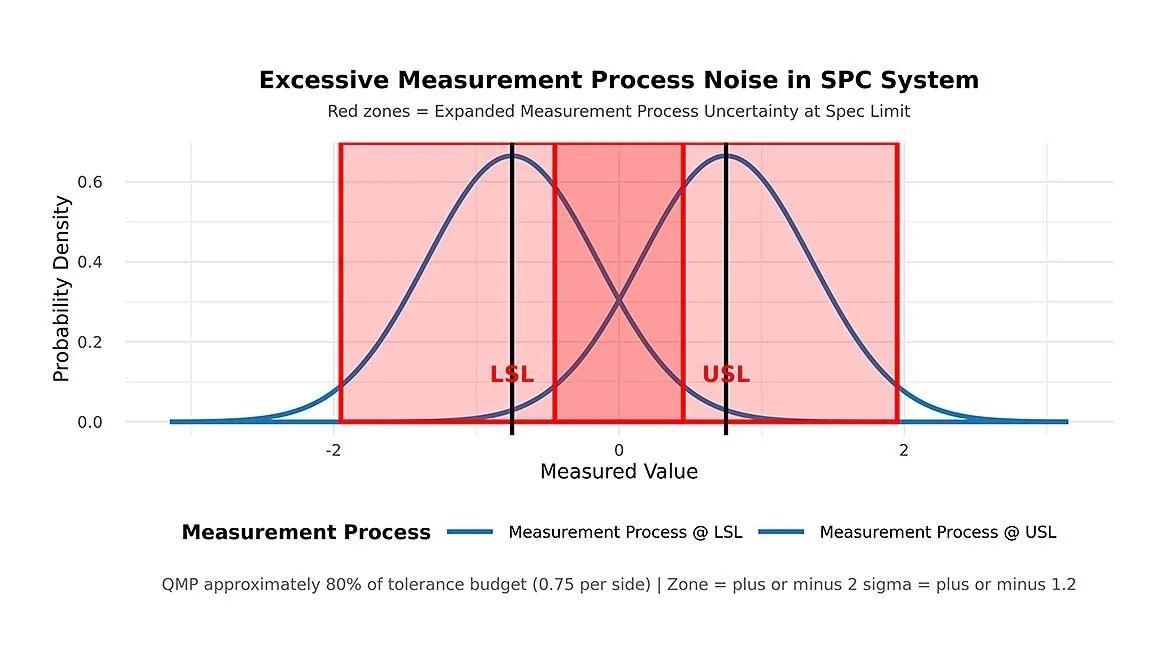
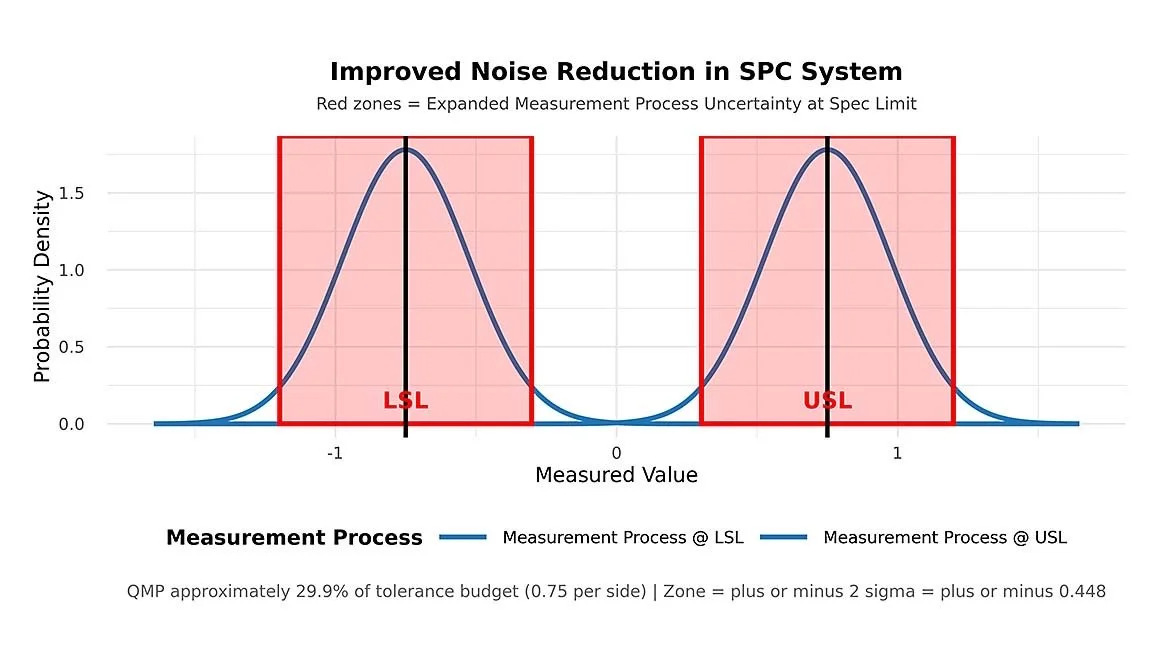
Statistical Process Control is a critical tool used in many industries to monitor complex processes that could pose a serious financial or safety risk. Decades ago, the automotive industry was looking for ways to improve productivity and reduce waste. While doing so, they determined that variation in the measurement system itself either through complex gaging fixtures or even simple dimensional inspection equipment could create a large amount of noise in the SPC system.
Excess noise in the SPC system makes analysis and problem solving more difficult because it can become harder to determine whether a part is actually passing or failing in many situations. In mass production, the excess noise in the SPC system can cause major problems for quality and production workers trying to meet strict requirements and short deadlines.
In order to address this issue, a Measurement System Analysis requirement was developed in the IATF 16949 standard, requiring many automotive factories to conduct statistical analysis on their measurement systems. This has become a routine audit finding for many factories. Measurement System Analysis currently ranks 4 in major nonconformities, according to recent data from the IATF.
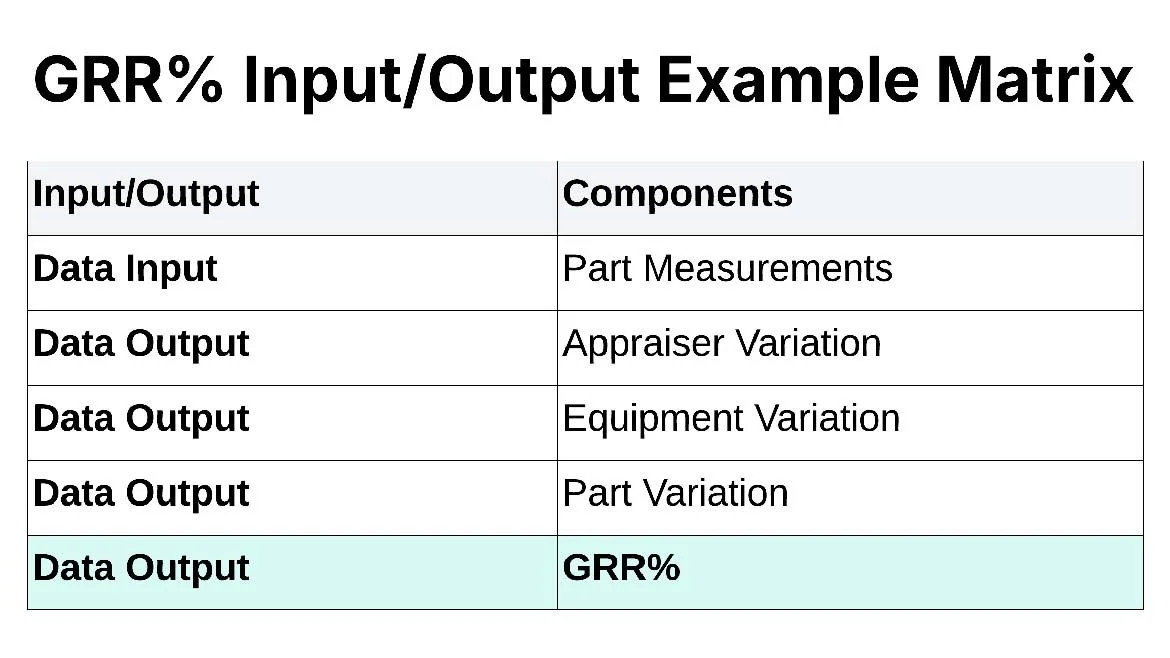
The Automotive Industry Action Group developed a handbook for conducting Measurement System Analysis which has been used as a guide for not just the automotive industry, but other industries as well. Most auditors and OEM suppliers use a metric called GRR% to measure how much variation the measurement system is generating. The most common test is to use 10 parts, 3 operators, and 3 trials as the data inputs. The output tells you how much of the variation of the measurement system is caused by repeatability, reproducibility, and the parts themselves. By doing analysis, you can break the variation down into separate components to determine if the equipment or the operators are causing excessive variation. The GRR% target of less than 10% has been codified across many different standard operating procedures worldwide.
The handbook goes well beyond a simple GRR%. It covers linearity, bias, stability, and destructive testing, but GRR% only covers repeatability and reproducibility. It doesn’t aggregate everything into one decision metric, and it doesn’t capture temperature influences or account for testing or calibration uncertainties from the labs.
Calibration of the measurement equipment is a major driver of measurement variation. IATF 16949 references ISO/IEC 17025:2017 for the calibration and testing labs that support the automotive industry. The requirements allow some flexibility for in-house calibration, but 17025 accredited labs are generally preferred. ISO/IEC 17025:2017 requires labs to evaluate measurement uncertainty in line with the GUM (ISO/IEC Guide 98-3:2008 / JCGM 100). The GUM method is more robust, letting technicians include as many input variables as needed and combine them into a single output, which can be used for decision making.
Moving beyond a GRR% only view toward a GUM based capability approach can drive meaningful cost savings. Automotive already invests heavily to meet ISO/IEC 17025 through labor, equipment, and training. Those costs remain, but connecting lab uncertainty data to factory decisions means the data finally informs planning and Lean Six Sigma, instead of being archived.
To improve measurement process capability, the Association of the German Automotive Industry developed their own measurement process capability procedures and published it in VDA 5. The VDA 5 standard is based on the procedures set forth in ISO 22514-7:2021, Capability of measurement processes. In this procedure a streamlined version of the GUM method is used to model various components of uncertainty, and a final capability index is used for decision making regarding the measurement process. It’s a much more robust and internationally recognized way of analyzing measurement systems.
The German and American automotive industries are heavily intertwined, so it doesn’t make sense to carry multiple standards for calibration and measurement system analysis. To address this, AIAG and VDA began harmonizing their manuals. The Failure Mode and Effects Analysis (FMEA) handbook was merged and published in 2019. AIAG has also said that the 2026 AIAG Quality Summit will spotlight updates to the AIAG & VDA SPC and MSA manuals. It’s clear that joint plans are in the works.
Building a VDA 5 Style Budget
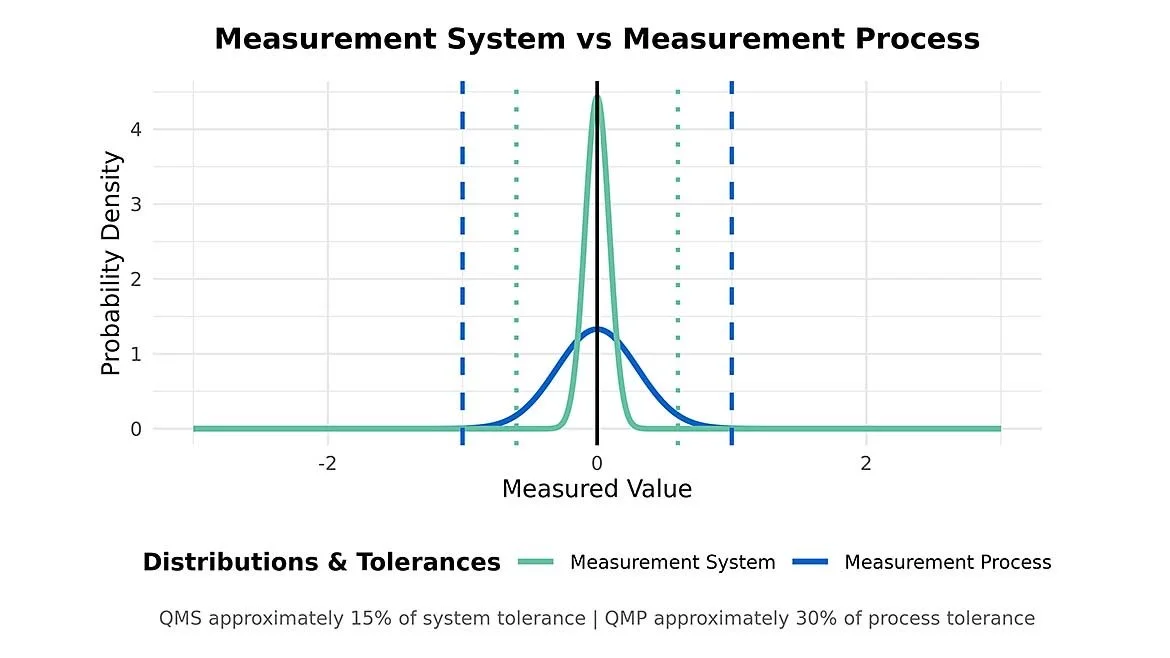
A VDA 5 style uncertainty budget breaks the measurement problem into two categories: the measurement system (equipment, calibration, software, fixtures) and the measurement process (how parts are measured: operators, part interaction, environment). If you don’t need a full breakdown, you can use a Maximum Permissible Error (MPE) to simplify the model.
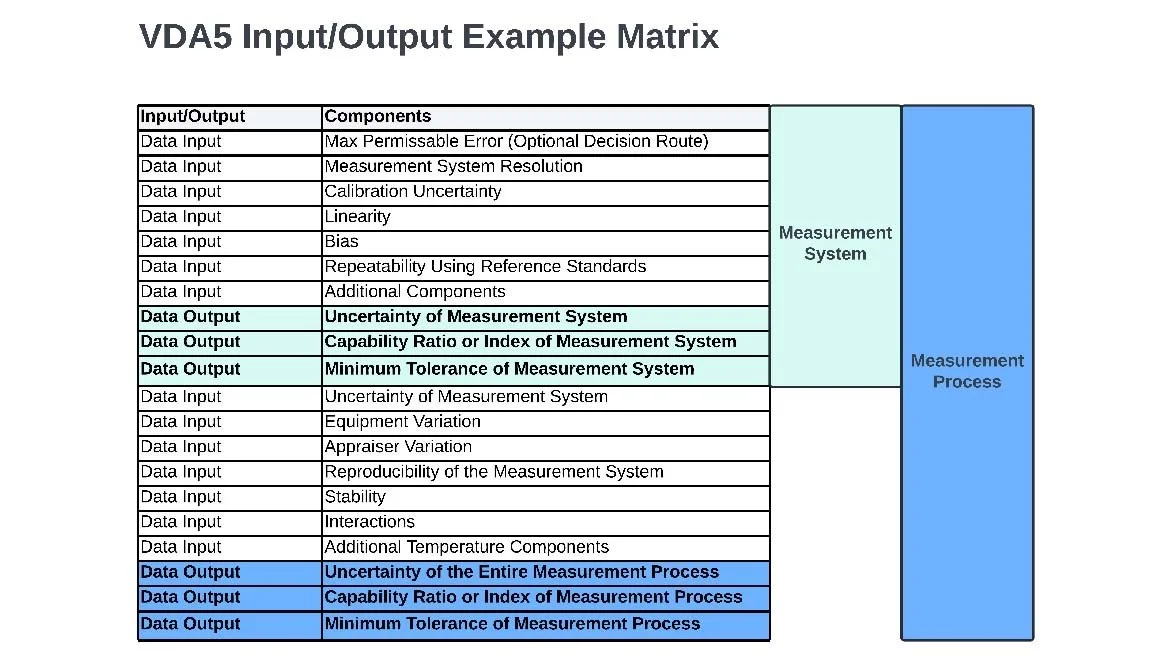
Start with the measurement system. Estimate each component’s standard uncertainty, combine them by root sum-of-squares (RSS) per GUM, and compare the result to a measurement system capability index/ratio. Then move the equipment into production and collect data on how it behaves with real parts, operators, and environment. Add those contributors to the same budget, combine again, and compare to a measurement process capability index/ratio. Most calibration labs already work with Test Uncertainty Ratio (TUR), so this approach lines up cleanly with existing lab procedures.
Because everything lives on one budget, it’s fast to see what’s driving excess noise in SPC. If the capability ratio is tight, you can spot the row that’s eating the tolerance and make a targeted change without a lot of guesswork.
For complex systems (robotic inspection, closed loop controls, long cable runs, sensors), a multi-variable budget is essential. Even something as simple as wiring and signal conditioning can add measurable variation. Modeling those terms up front cuts debug time and keeps teams from chasing process “ghosts” that are really measurement effects.
Minimum Tolerance Testing
VDA5 lets you take the inputs from your uncertainty budget and run them in reverse to get a minimum tolerance for both the measurement system and the measurement process. The common acceptance limits are that measurement uncertainty should consume up to 15% of the measurement system and 30% of the measurement process.
Here is how it works: You pull the expanded uncertainty from your budget (k=2) and solve for the smallest tolerance that still meets the limit.
Minimum Tolerance of the Measurement System = Uncertainty of Measurement System / 0.15
Minimum Tolerance of the Measurement Process = Uncertainty of Measurement Process / 0.30
If the tolerances on the drawing are smaller than the calculated minimum tolerances, there could be measurement problems once it goes to production. At this point you would flag the process for further review rather than sending it to mass production.
This testing methodology is a major cost saver because it can identify tolerancing problems before technicians start programming robots, PLC systems, and writing work instructions. If these problems were identified during mass production, it could be extremely expensive to mitigate and increase risks of audit non-conformances.
Risk-Based Assurance in VDA5
VDA5 has a risk-based assurance procedure that lets measurement planners combine a procedural, risk driven approach with economic realities to sort inspection into sensible risk categories. Instead of treating every feature the same, you set different procedures for high, medium, and low-risk items based on safety impact, legal/customer requirements, scrap costs, and defect rates.
It saves money because it cuts noise in the quality system and pushes evidence based financial budgeting. It doesn’t make sense to pour money into equipment, training, and analysis for low-risk checks when those resources are needed for crucial measurements.
More Cost Savings From Harmonization
If the harmonization project is successful, there will be real opportunities for additional cost savings. Quality planners and auditors will be on the same page as the test and calibration labs. ISO 17025 lab data will flow faster into quality planning and approvals. That speeds up communication and cuts confusion.
GRR% results can be folded into uncertainty budgets for teams that don’t want big process changes. Maximum Permissible Error (MPE) can also simplify uncertainty for systems that don’t need a full-blown analysis.
Audit nonconformities should go down because everyone is using the same language and metrics. SOPs will be easier to write and follow.
Laboratory operations won’t need any adjustments or capital expenditures. Advanced Quality Engineers, auditors, and Lean Six Sigma specialists will just need basic training to read budgets and interpret capability ratios.
References
ISO 22514-7:2021 — Capability of measurement processes (and Amd. 1:2024). International Organization for Standardization. https://www.iso.org/standard/80624.html
VDA 5 — Measurement and Inspection Processes (Capability, Planning and Management), 3rd revised ed., July 2021. VDA QMC. (English edition available; see Publications/Webshop).
https://vda-qmc.de/en/ (Publications → VDA 5)
Measurement Systems Analysis (MSA), 4th Edition (MSA-4). AIAG, 2010.
https://www.aiag.org/training-and-resources/manuals/details/MSA-4
The ASQ Metrology Handbook, 3rd Edition. ASQ Quality Press, 2023.
German Association of the Automotive Industry (VDA QMC) — IATF Certificates Worldwide. (n.d.)
IATF Global Oversight — Statistics.
AIAG Quality Summit — Registration/Event Page.
Dan Lay Jr. is a certified Measurement System Analysis specialist and Metrologist with a passion for bridging the gap between theory and production floor realities. https://www.linkedin.com/in/dlayjr/
